Standard deviation
calculator
Standard deviation measures how spread out a set of numbers is around their average. Paste your values and get both the sample and population figures, with the mean.
Doing it by hand too?
A few solid picks. As an Amazon Associate, Calculate.to earns from qualifying purchases, at no extra cost to you.
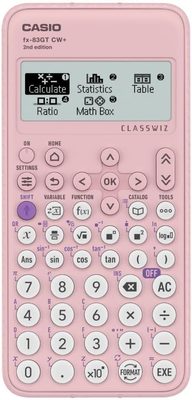
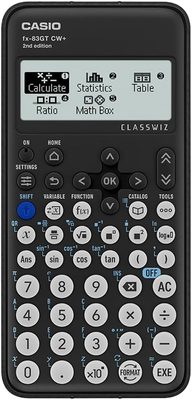
 Casio fx-83GTCW+
The UK classroom-standard scientific calculator (also in pink), allowed in most UK exams.
View on Amazon →
Casio fx-83GTCW+
The UK classroom-standard scientific calculator (also in pink), allowed in most UK exams.
View on Amazon →
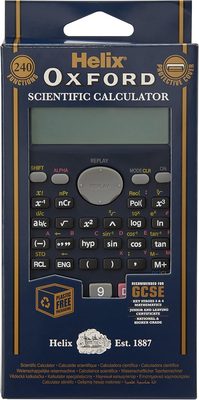
 Helix Oxford Scientific
240-function scientific calculator for KS3–KS4 maths, with hard cover. Exam-friendly, plastic-free packaging.
View on Amazon →
Helix Oxford Scientific
240-function scientific calculator for KS3–KS4 maths, with hard cover. Exam-friendly, plastic-free packaging.
View on Amazon →
 OSALO Desktop Calculator
Extra-large 12-digit LCD, giant buttons, solar + battery, the classic office desk workhorse.
View on Amazon →
OSALO Desktop Calculator
Extra-large 12-digit LCD, giant buttons, solar + battery, the classic office desk workhorse.
View on Amazon →
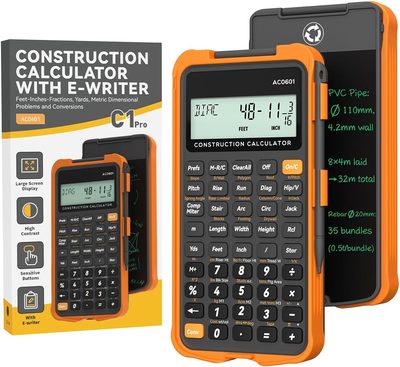
 ROATEE Construction Calc
Feet-inch-fraction engineering calculator for carpenters, framers and contractors on site.
View on Amazon →
ROATEE Construction Calc
Feet-inch-fraction engineering calculator for carpenters, framers and contractors on site.
View on Amazon →
Sample vs population
If your numbers are the whole group you care about, use the population standard deviation, which divides the squared differences by n. If they are a sample standing in for a bigger group, use the sample version, which divides by n minus 1 (Bessel's correction) and is a little larger.
Reading the number
A small standard deviation means the values cluster tightly around the mean; a large one means they are spread out. It is in the same units as your data, so scores in points give a spread in points. Variance is simply the square of it.
Standard deviation FAQ
Use population when your data is the entire set. Use sample when it is a subset you are generalising from, which is the more common case in statistics.
Variance is the average of the squared differences from the mean. Standard deviation is its square root, which puts the spread back into the original units.
Separate values with commas, spaces or new lines. Decimals and negatives are fine; anything that is not a number is ignored.
Dividing a sample by n minus 1 corrects a bias that would otherwise make the spread look smaller than the true population value.